Introduction – Sizing a PV Array to Meet Building Demands
Sizing a PV array correctly is not as simple as measuring the roof and filling it full of panels. With ever improving panel efficiencies, varying amounts of site demand and a saturated Distribution Network, many aspects need to be taken into consideration when designing the correct system.
Sizing a PV array correctly is not as simple as measuring the roof and filling it full of panels. With ever improving panel efficiencies, varying amounts of site demand and a saturated Distribution Network, many aspects need to be taken into consideration when designing the correct system.
In Summary......
Here at Watt Energy Saver we understand the detailed design process required to not only gain a grid connection, but design the system which meets the particular client’s requirements.
By engaging with Watt Energy Saver our clients get more than just a contractor’s approach of maximising the capacity of the roof.
Our consultative design led principles help us understand the client’s requirements, be it maximising self-consumption, cutting CO2 or long term investment. No matter what the case, one common denominator is always required. Existing consumption.
Ideally this will be in the form of 12 months of historical Half Hourly metering data. This allows our engineers to accurately profile energy usage on the site and begin to model the PV array in the latest design software.
This detailed approach allows us to deliver accurate yields and self-consumption data resulting in accurate return on investment calculations.
Our Experience Tells Us .....
In a relatively immature marketplace, we often come across inaccurate self-consumption figures. These estimations are usually way in excess of what will actually be consumed on site, skewing the figures, usually in favour of the contractor and providing poor information for the customer to make decisions upon.
It is also becoming increasingly common for the Distribution Network Operation (DNO) to require 6 figure sums to upgrade the network, if possible at all.
With the site energy profile Watt Energy Saver are able to design an array to match the DNO’s capacity, and if site consumption allows, design an export limitation system to vary generation to meet the DNO’s limits.
Again, the detailed level of design allows us to design a system such that the PV array would not export, leaving the export limitation as a safety device and allowing the customer to install a potentially bigger array with no DNO upgrade fees.
Watt Energy take the same approach no matter the project size ensuring accurate design which delivers accurate figures for the customers review. We set out below the design process we undertake to ensure we offer our customers the best value whilst meeting design obligations.
Step 1 – Determine Site Consumption – kWh/Annum
As we have eluded to previously, the prime information required is based around consumption data. To deliver accurate results we recommend the use of 12 months historic Half Hourly data. This data can be requested from your energy supplier in a .csv (Excel) format.
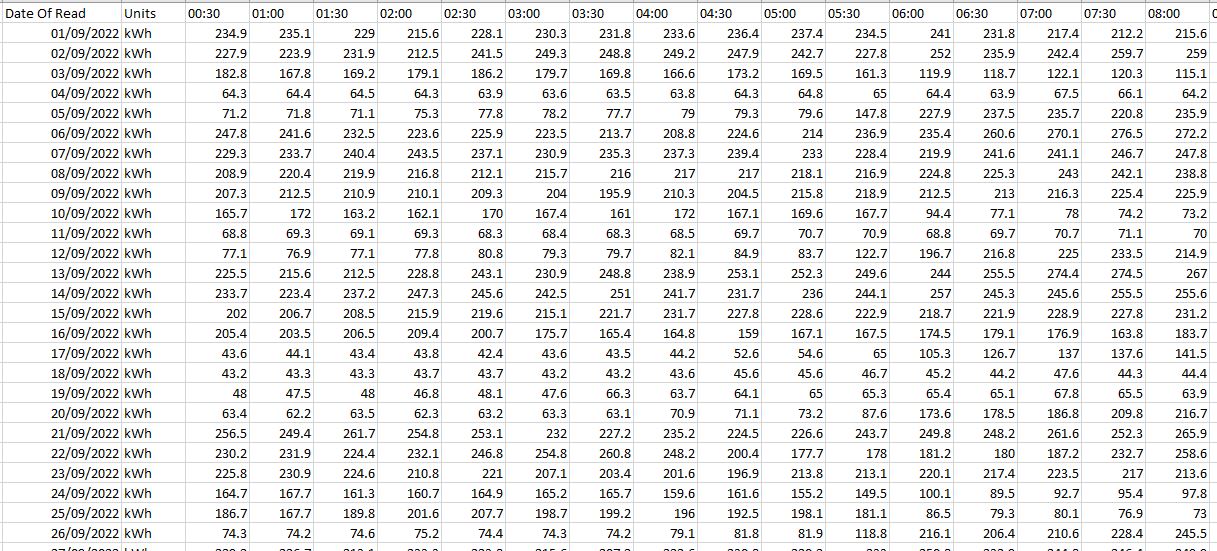
Example snap shot of Half Hourly Meter Data
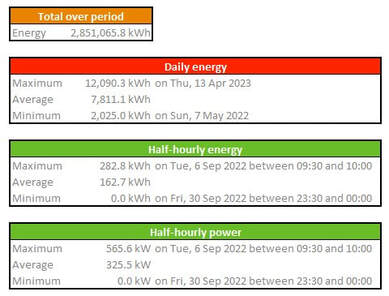
We take the raw data and strip away unwanted information and summarise the annual consumption.
We take the raw data and strip away unwanted information and summarise the annual consumption.
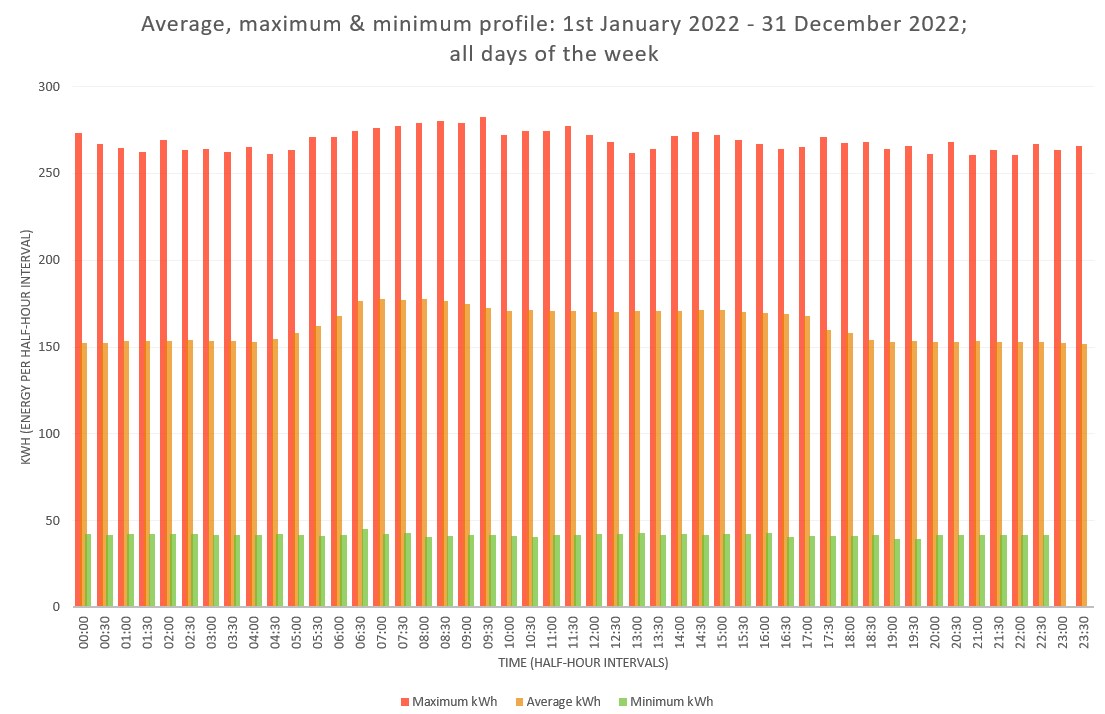
In addition, we can pinpoint both maximum and minimum demand. This helps understand the site process and enables the customer to verify energy is being used at the correct period of the day, month or year.
Once the Half Hourly data has been processed, it is imported into our design software. Here the site consumption profile is matched to the annual solar yield potential.
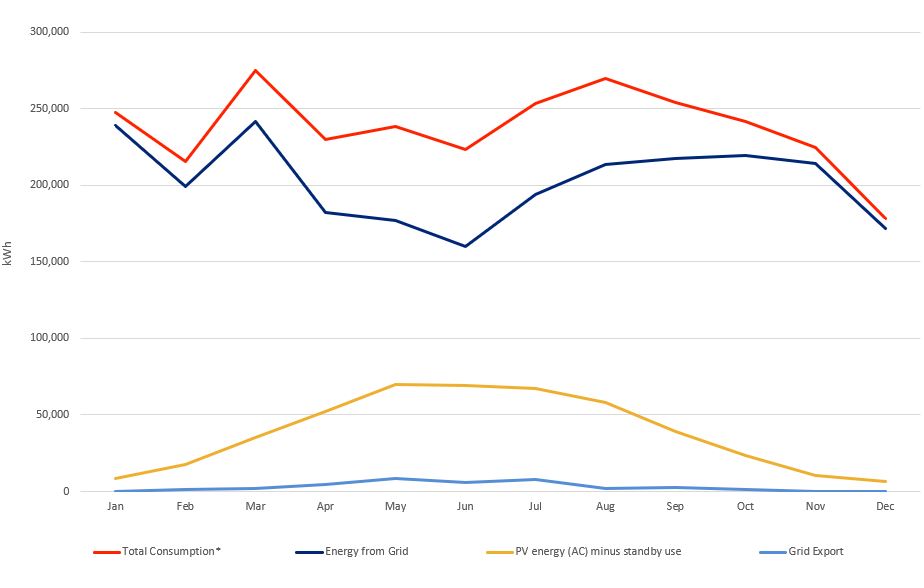
Every 30 minutes throughout a 12 month period, the software checks whether the site consumption is more or less than the solar generated energy. The graph below shows a typical example of a recent cold store completed by Watt Energy Saver.
Every 30 minutes throughout a 12 month period, the software checks whether the site consumption is more or less than the solar generated energy. The graph below shows a typical example of a recent cold store completed by Watt Energy Saver.
• The RED line shows site electrical consumption over a 12 month period.
• The YELLOW line represents the amount of solar energy generated, again over a 12 month period.
• The DARK BLUE line shows the revised grid supplied electricity after the solar PV has been installed.
• Finally, the LIGHT BLUE line depicts the amount of electricity which is exported to the grid.
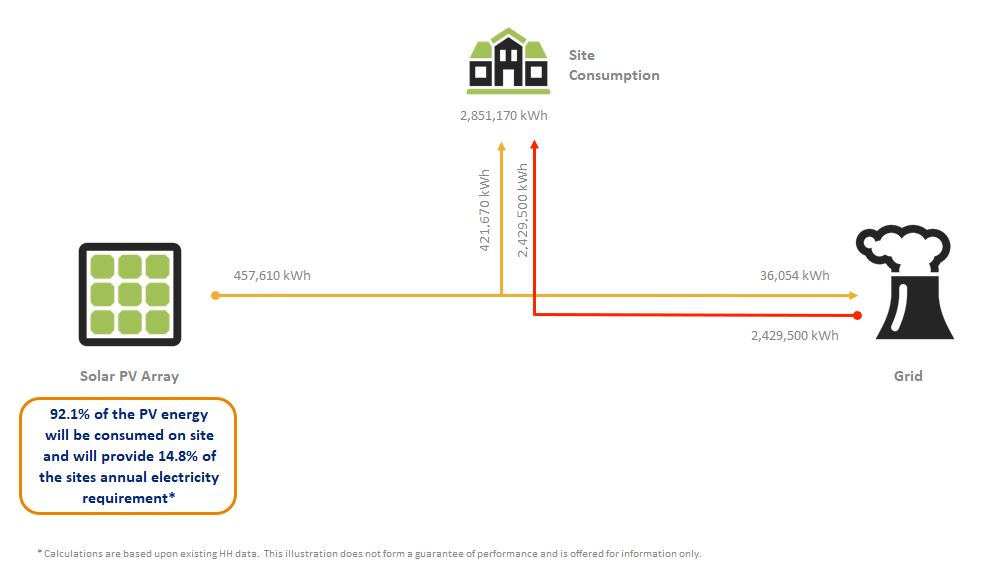
From these calculations, we were able to establish that a 557.28kWp would result in around 92.1% self-consumption.
PV Generator Output - 557.28 kWp
Performance Ratio (PR) - 90.71 %
PV Generator Energy (AC grid) - 457,724 kWh/Year
Grid Export - 36,054 kWh/Year
Own Power Consumption - 92.1 %
Several scenarios can be quickly run to ascertain the most cost effective solution, taking into account panel selection, inverter matching, mounting system, space planning etc.
In this instance, self-consumption was important as a quick ROI was desirable. As an additional cold store was being built, the 8% which was shown as being exported in our calculations would be consumed when the new store came online.
In this instance, self-consumption was important as a quick ROI was desirable. As an additional cold store was being built, the 8% which was shown as being exported in our calculations would be consumed when the new store came online.


